Integrated Kidney Exosome Analysis for the Detection of Kidney Transplant Rejection.
Authors:
Park J, Lin HY, Assaker JP1, Jeong S, Huang CH, Kurdi T1, Lee K, Fraser K, Min C, Eskandari S1, Routray S1, Tannous B2, Abdi R1, Riella L1, Chandraker A1, Castro CM, Weissleder R3, Lee H, Azzi JR1.
Abstract
Kidney transplant patients require life-long surveillance to detect allograft rejection. Repeated biopsy, albeit the clinical gold standard, is an invasive procedure with the risk of complications and comparatively high cost. Conversely, serum creatinine or urinary proteins are noninvasive alternatives but are late markers with low specificity. We report a urine-based platform to detect kidney transplant rejection. Termed iKEA (integrated kidney exosome analysis), the approach detects extracellular vesicles (EVs) released by immune cells into urine; we reasoned that T cells, attacking kidney allografts, would shed EVs, which in turn can be used as a surrogate marker for inflammation. We optimized iKEA to detect T-cell-derived EVs and implemented a portable sensing system. When applied to clinical urine samples, iKEA revealed high level of CD3-positive EVs in kidney rejection patients and achieved high detection accuracy (91.1%). Fast, noninvasive, and cost-effective, iKEA could offer new opportunities in managing transplant recipients, perhaps even in a home setting.
ACS Nano. 2017 Nov 28;11(11):11041-11046.
Figure
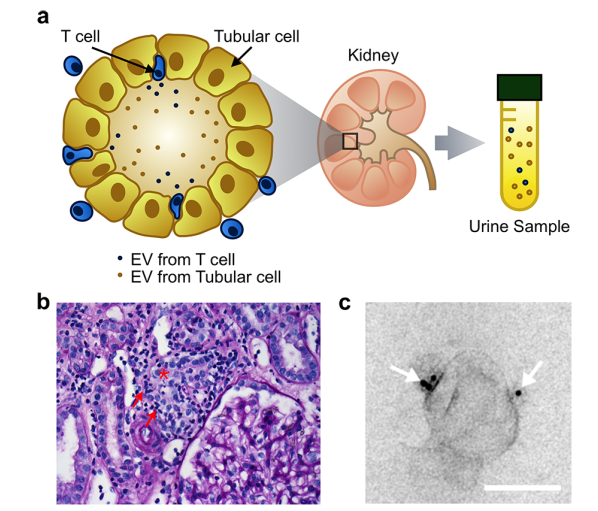
T-cell-derived EVs in urine samples from patients under
kidney transplant rejection. (a) Schematics showing how T-cellderived
EVs can be present in patient urine samples. During acute
cellular rejection (ACR), T cells infiltrate into kidney and can
secrete their EVs into the tubule. Released EVs are then collected in
urine. (b) Histology of a kidney tissue from a ACR patient. The
image shows multiple tubules where tubular cells are marked with
an asterisk. The tubule in the middle has lymphocytes (arrows)
causing tubulitis. (c) Electron micrograph of a urinary EV (uEV)
from an ACR patient. uEVs were immunogold stained for CD3.
Scale bar, 50 nm. White arrows indicate CD3 immunogold staining.