Background: Kidney transplant recipients are currently treated with nonspecific immunosuppressants that cause severe systemic side effects. Current immunosuppressants were developed based on their effect on T-cell activation rather than the underlying mechanisms driving alloimmune responses. Thus, understanding the role of the intragraft microenvironment will help us identify more directed therapies with lower side effects.
Methods: To understand the role of the alloimmune response and the intragraft microenvironment in cellular rejection progression, we conducted a Single nucleus RNA sequencing (snRNA-seq) on one human non-rejecting kidney allograft sample, one borderline sample, and T-cell mediated rejection (TCMR) sample (Banff IIa). We studied the differential gene expression and enriched pathways in different conditions, in addition to ligand-receptor (L-R) interactions.
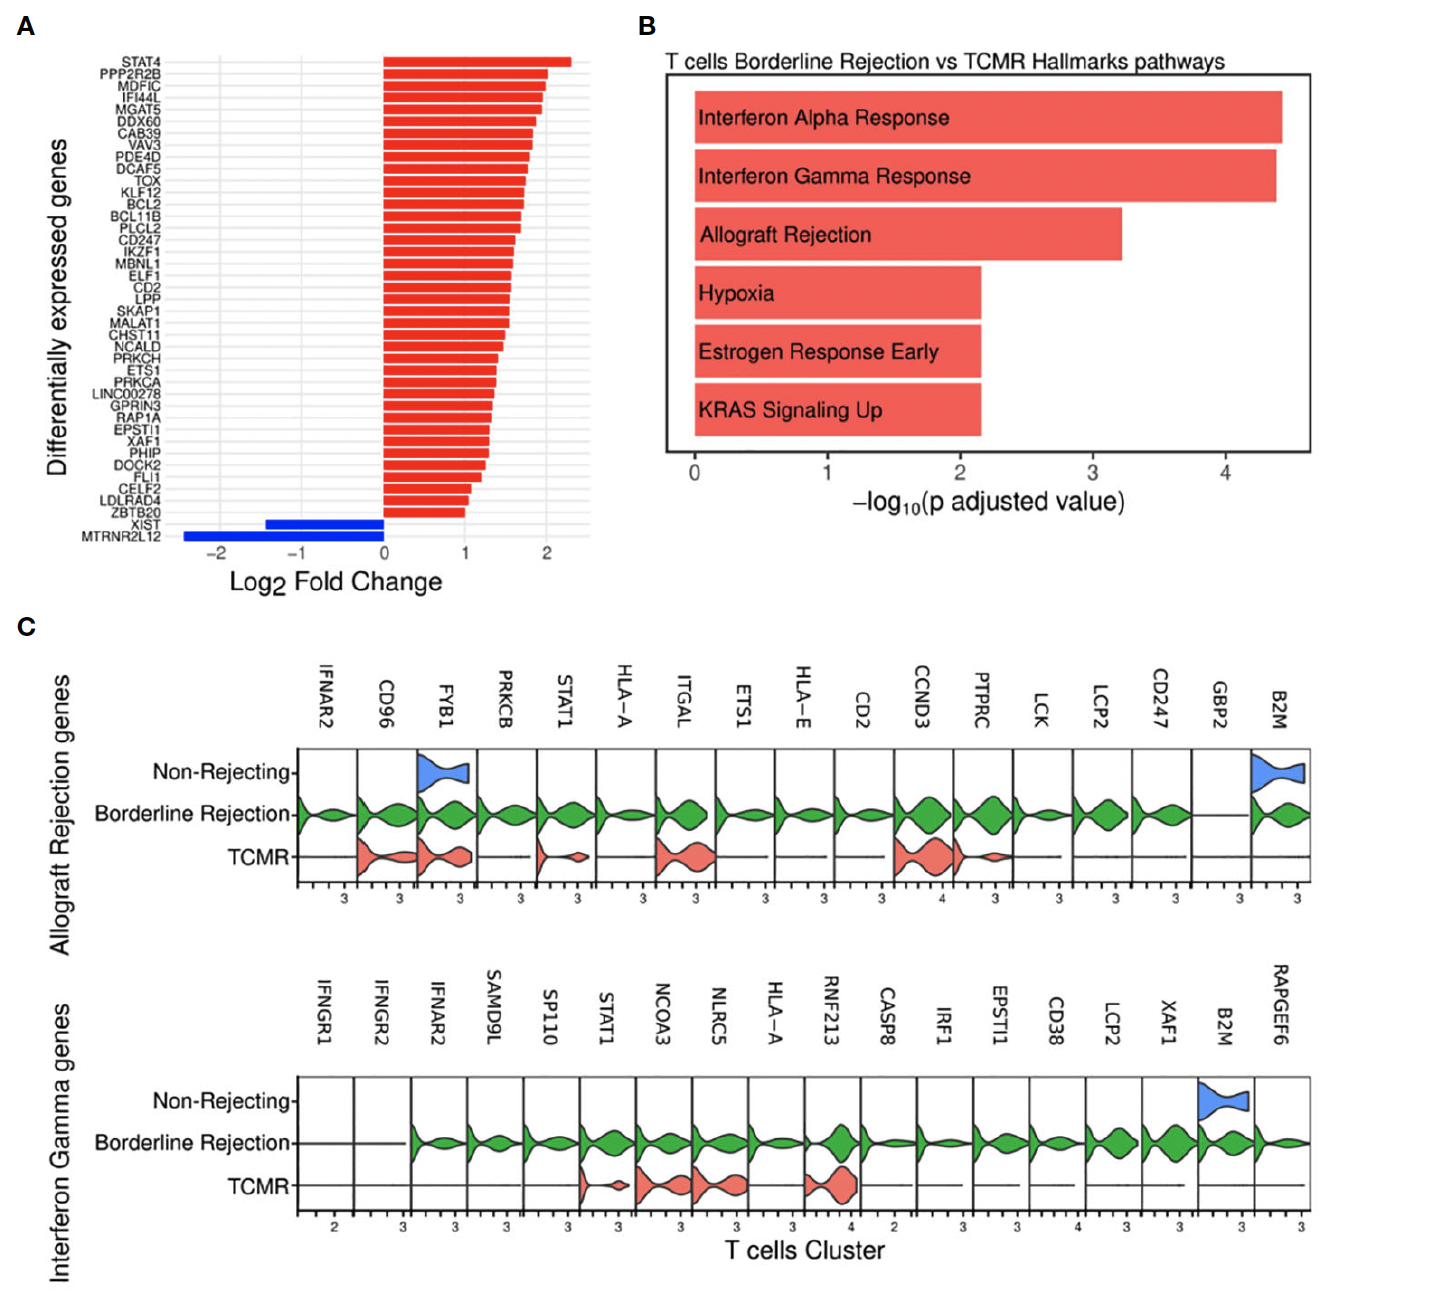
Results: Pathway analysis of T-cells in borderline sample showed enrichment for allograft rejection pathway, suggesting that the borderline sample reflects an early rejection. Hence, this allows for studying the early stages of cellular rejection. Moreover, we showed that focal adhesion (FA), IFNg pathways, and endomucin (EMCN) were significantly upregulated in endothelial cell clusters (ECs) of borderline compared to ECs TCMR. Furthermore, we found that pericytes in TCMR seem to favor endothelial permeability compared to borderline. Similarly, T-cells interaction with ECs in borderline differs from TCMR by involving DAMPS-TLRs interactions.
Conclusion: Our data revealed novel roles of T-cells, ECs, and pericytes in cellular rejection progression, providing new clues on the pathophysiology of allograft rejection.